Pressure for parts: Thegrowth ofMOT deserts
With more cars on the road and fewer MOT centres available, more drivers are having a tough time getting their cars serviced quickly.
We looked at where vehicle owners are struggling the most.

TOP 4 ‘MOT DESERTS’ IN THE UK
An ‘MOT desert’ refers to a growing number of people in an urban area trying to access a diminishing pool of MOT centres.
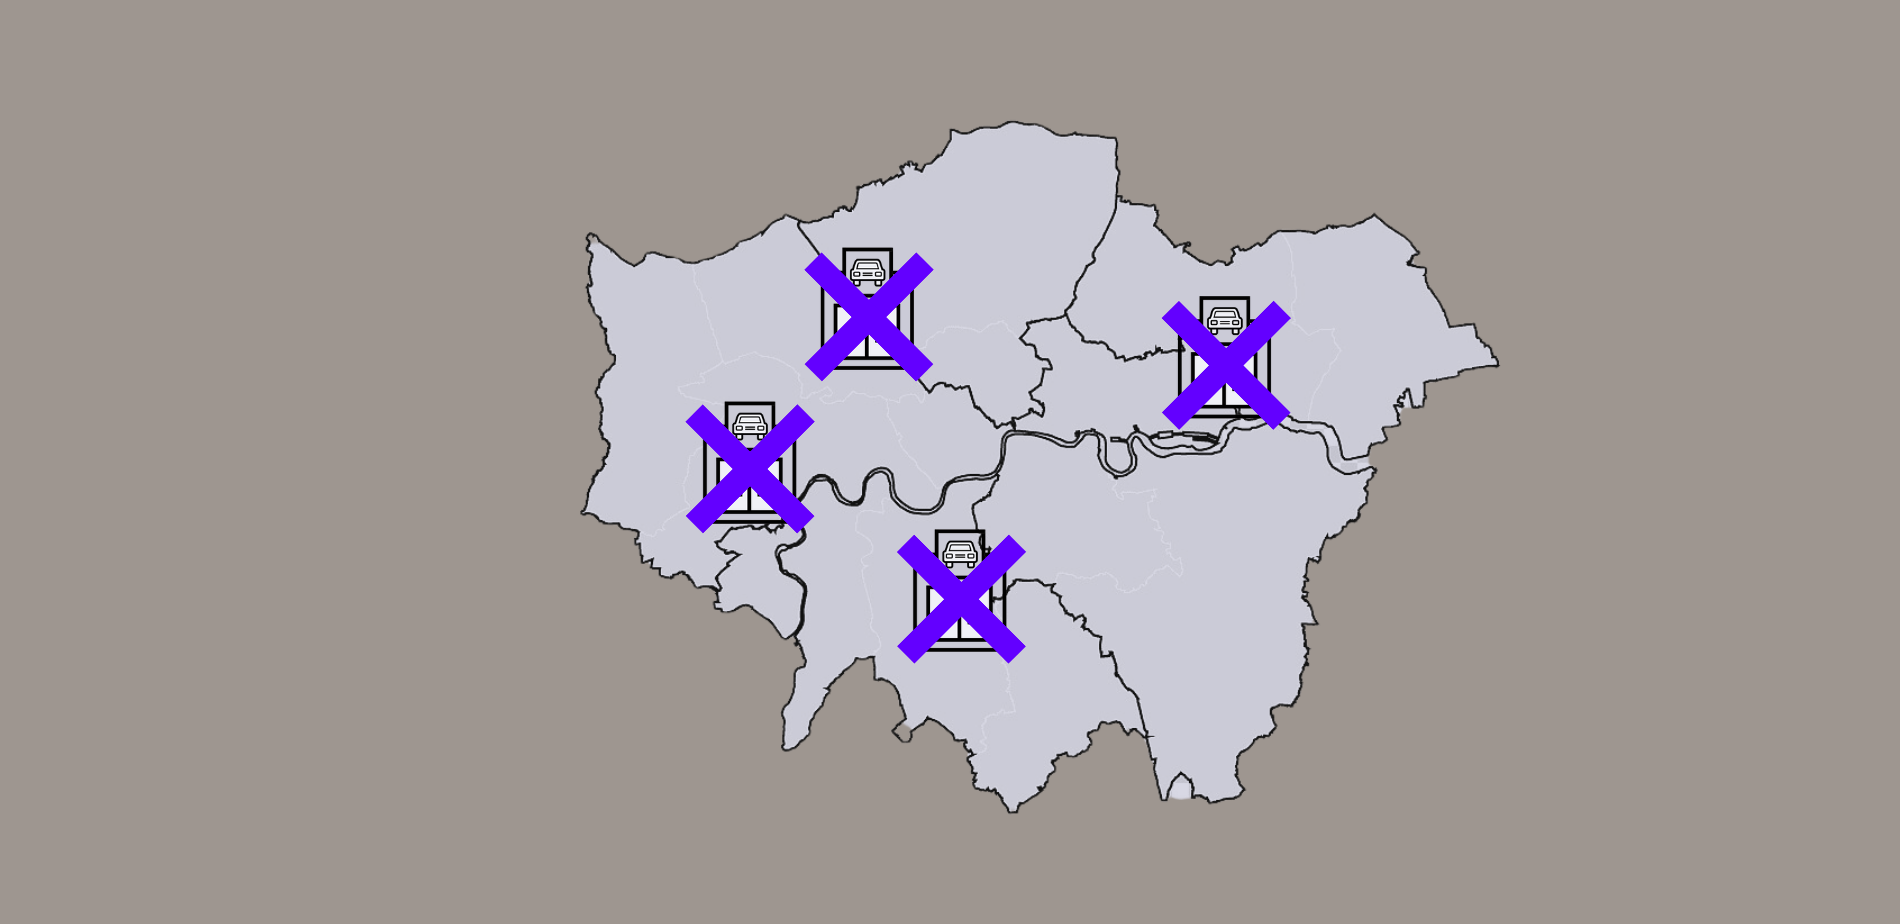
WHICH AREAS IN LONDON HAVE THE HIGHEST RATIO OF CARS TO MOT CENTRES?
- 4,819 North West London
- 4,043 South West London
- 3,448 North East London
- 3,232 West London
Source: GOV.UK

ULEZ impact on London MOT centres
There are 658 MOT centres in London’s Ultra Low Emission Zone (ULEZ) which aren’t going to be destination of choice for drivers with non compliant vehicles, putting more pressure on centres in the surrounding areas.

Source: AM Online

Total number of MOT centres in the UK:
2018-2019:
89,365
2019-2020:
89,341
2020-2021:
88,120
Source: GOV.UK
Relieving Delivery Pressures
With more cars and fewer centres, the onus is on speed and how quickly garages can get vehicles back on the road.
And that speed is often determined by how quickly you can get the part delivered.
Which is where Gophr comes in 👋 supporting OEM and motor factor suppliers with ‘just in time’ same day deliveries.
To find out more about how we can help, please get in touch below.

MOTs explained
A vehicle MOT is an annual test of roadworthiness, which applies to vehicles that are over three years old.
A typical MOT test takes around 45 minutes to complete and includes dozens of different checks on a car, including checking the brakes, electrics, windscreen wipers, and exhaust system.
Once passed, an MOT certificate is issued, which is valid for one year with no grace period. Once a year has passed, the car is no longer legal to drive until a new MOT test has been completed.
Source: GOV.UK
Full data
| Location (excl. London) |
Number of cars per MOT centre
|
| Bromley | 2436 |
| Sutton | 2073 |
| Leeds | 1722 |
| Lerwick | 1670 |
| Slough | 1624 |
| Wigan | 1580 |
| Sunderland | 1433 |
| Milton Keynes | 1425 |
| Stockport | 1392 |
| North Lanarkshire and Motherwell | 1284 |
| Kirkcaldy and Fife | 1282 |
| Enfield | 1209 |
| Harrogate | 1206 |
| Telford | 1189 |
| Swindon | 1170 |
| St Albans | 1078 |
| Croydon | 1043 |
| Galashiels | 1032 |
| Harrow and Wembley | 996 |
| Dudley | 968 |
| Perth | 961 |
| Dumfries | 927 |
| Bradford | 893 |
| Bournemouth | 860 |
| Bolton | 834 |
| Luton | 815 |
| Wakefield | 739 |
| Falkirk | 739 |
| Walsall | 724 |
| Paisley | 724 |
| Glasgow | 719 |
| Wolverhampton | 698 |
| Birmingham | 658 |
| Liverpool | 653 |
| Edinburgh | 648 |
| Watford | 617 |
| Aberdeen and Aberdeenshire | 614 |
| Oldham | 532 |
| Dundee | 526 |
| Blackpool | 521 |
| Colchester | 506 |
| Hull | 499 |
| Warrington | 498 |
| Manchester | 495 |
| Southend (Essex) | 492 |
| Kingston upon Thames | 488 |
| Bristol | 470 |
| Doncaster | 469 |
| Coventry | 461 |
| Taunton | 454 |
| Lancaster | 438 |
| Sheffield | 430 |
| Stoke on Trent | 430 |
| Kilmarnock | 416 |
| Bath | 414 |
| Plymouth | 409 |
| Leicester | 405 |
| Worcester | 399 |
| Dartford | 396 |
| Canterbury | 396 |
| Cardiff | 392 |
| Chelmsford | 391 |
| Darlington | 390 |
| Brighton | 383 |
| Peterborough | 382 |
| Swansea | 370 |
| Newport | 368 |
| Derby | 366 |
| Southampton | 361 |
| Portsmouth | 349 |
| York | 303 |
| Blackburn | 300 |
| Guildford | 298 |
| Carlisle | 296 |
| Middlesborough | 281 |
| Preston | 270 |
| Stevenage | 262 |
| Cambridge | 251 |
| Lincoln | 246 |
| Newcastle | 244 |
| Wrexham | 242 |
| Reading | 224 |
| Nottingham | 221 |
| Tunbridge Wells | 215 |
| Gloucester | 213 |
| Ipswich | 207 |
| Exeter | 197 |
| Oxford | 195 |
| Norwich | 158 |
| Average | 547 |
| Location (London) |
Number of cars per MOT centre
|
| East London | 2627 |
| North East London | 3448 |
| North West London | 4819 |
| South East London | 2819 |
| South West London | 4043 |
| West London | 3232 |
| Average | 3498 |


